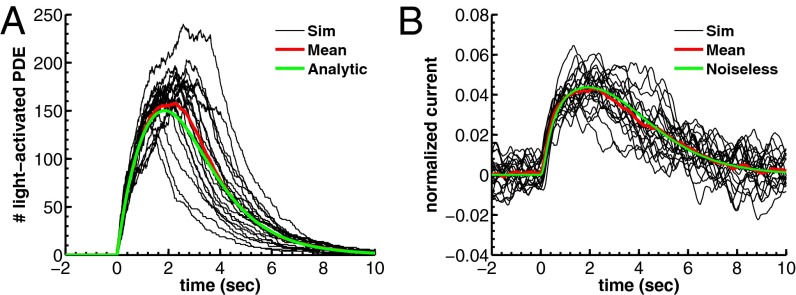
Fig. 1.
Simulation of dark noise and single-photon response for a toad rod. (A) Twenty simulations (black) of the light-activated PDE after a photon absorption with mean (red). The analytic mean (green) is computed from ref. 21. Time, mean, SD, and coefficient of variation (CV) of the peak number are 1.85 s, 150, 25, and 25/150 ≈ 0.17 (in agreement with predictions from figure 2e in ref. 21). (B) Superposition of 20 single-photon responses [black, normalized current  ] obtained with light-activated PDE from A and with
  . The noiseless simulation (green) is generated with the analytic curve from A. The SD of the dark noise is around 0.8%, and the theoretical value is 0.7% (SI Appendix, Eq. 53). Time, mean, SD, and CV of the peak current are 1.9 s, 4.4%, 0.9%, and 0.9/4.4 ≈ 0.20. All parameters are given in SI Appendix, Tables S3 and S4.

