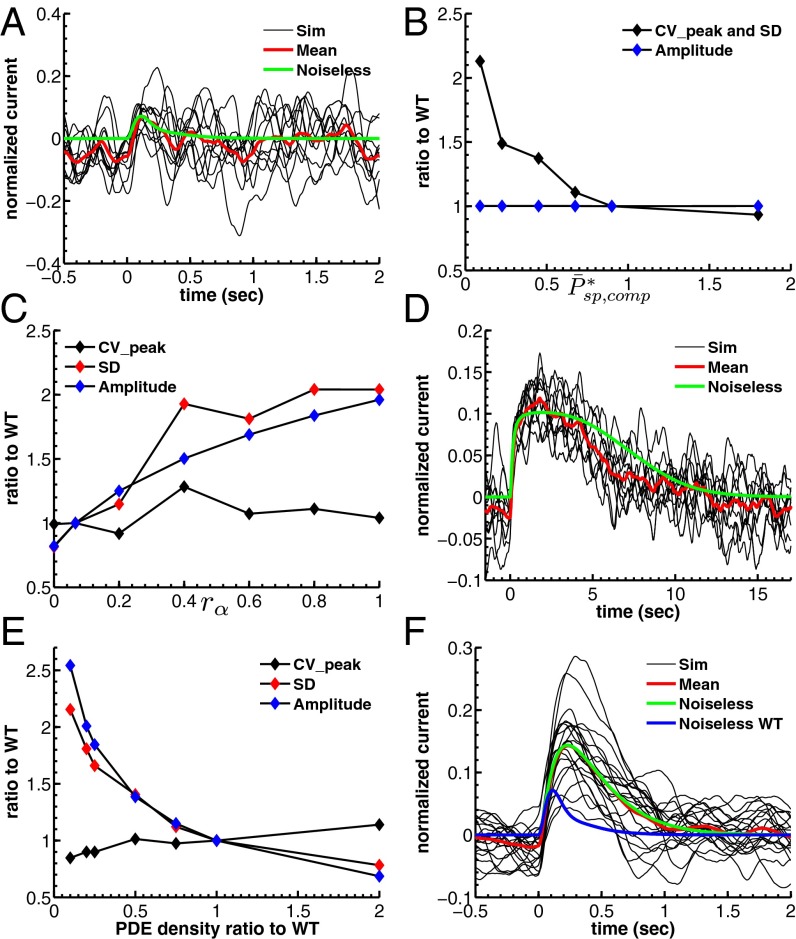
Fig. 5.
Dependence of single-photon response on spontaneous PDE activation, cyclase feedback, PDE density, and outer segment radius. (A) Ten single-photon response simulations for a mouse rod with  and
and  . (B) Mean, SD, and CV of the mouse peak response amplitude with respect to the WT situation depicted in Fig. 4B as a function of
  with constant
  achieved by adapting ksp (Eq. 2). Values are computed from 100 simulations. (C) Mean, SD, and CV as a function of calcium feedback on guanylyl cyclase. (D) Ten single-photon response simulations for a toad rod with a fourfold reduced OS radius and
  .
.  is reduced by a factor of 16, but kli and ksp are increased 16-fold due the higher encounter rate. (E) Mean, SD, and CV as a function of the PDE density.
  and βd both change (ksp is unchanged). (F) Twenty single-photon response simulations for a mouse rod with fivefold reduced PDE density such that
  and
and  .
.

