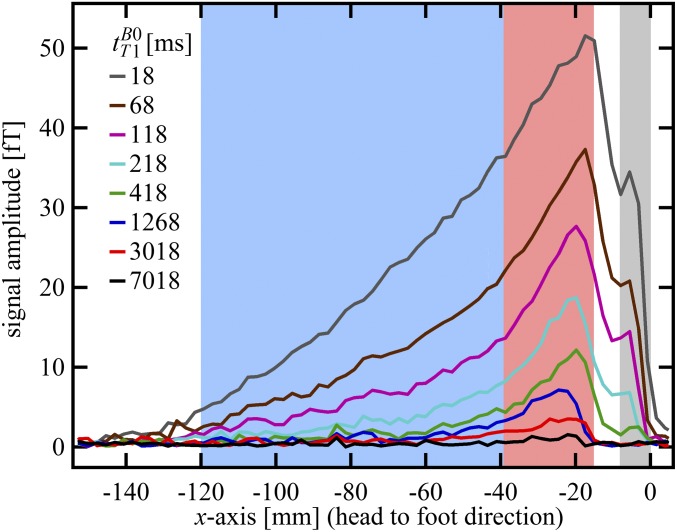
Fig. 3.
One-dimensional images of the brain acquired with frequency encoding along the x axis; the nominal spatial resolution is 2.5 mm. Each 1D image was obtained at one of the eight values of  listed on the figure. The bottom of the dewar and thus the top of the subject's head are at x = 0. The signal in the light gray region was integrated to perform exponential fits to obtain
  (fat). The same procedure was used for the light red and light blue regions to obtain
  (CSF) and
  (brain), respectively.

