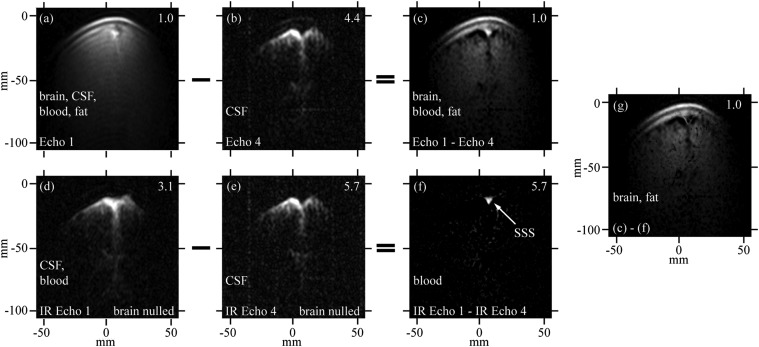
Fig. 4.
2D images of brain. Data acquired using an acquisition of a CPMG sequence (A and B) interleaved with an IR-CPMG sequence (D and E) with the inversion recovery delays adjusted to establish a signal null for brain tissue. C and F are obtained from the subtractions A − B and D − E, respectively. G is the subtraction C − F. Image amplitudes have been scaled to enhance visualization of features: scaling factors are given in the top right corner of each image. The nominal in-plane resolution is 2.5 mm (z) × 1.9 mm (x). The total imaging time was 25 min, 52 s. Frequency and phase encoding are along the z and x axes, respectively.

