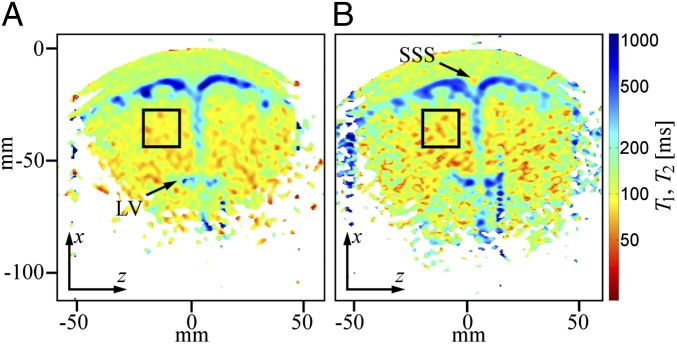
Fig. 5.
2D T1 and T2 maps of the brain. (A) T1 map acquired in 19 min, 20 s. The nominal in-plane resolution is 2.5 mm × 2.5 mm. (B) T2 map acquired in 4 min, 26 s. The nominal in-plane resolution is 2.5 mm × 1.9 mm. Black boxes indicate a region of interest used to derive an average relaxation time for brain tissue. The superior sagittal sinus location is indicated as SSS. Frequency and phase encoding are along the z and x axes, respectively.

