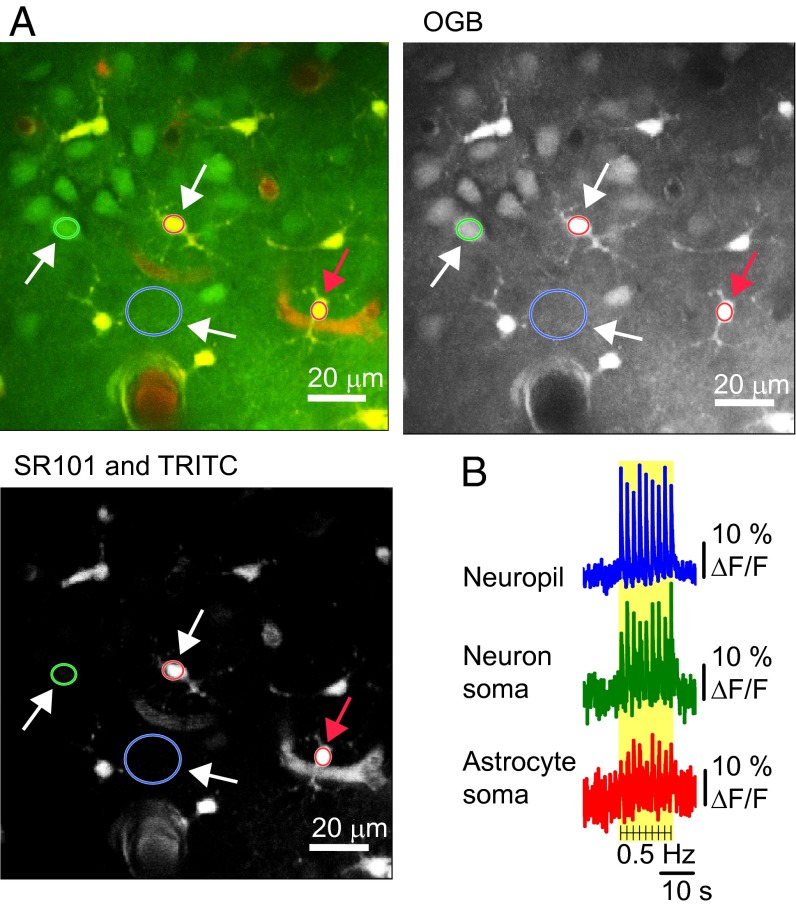
Fig. 1.
Ca2+ imaging during somatosensory stimulation reveals that both astrocytes and neurons have fast response patterns. (A) Double labeling allows distinction between astrocytic and neuronal structures. Layers II/III of the whisker barrel cortex were loaded with astrocyte-specific dye SR101 (red) in combination with the Ca2+ fluorophore OGB (green) and vascular TRITC-dextran (red). Regions of interest (ROIs) are marked with colored rings: one neuronal soma (green), two astrocyte somas (red), and one neuropil region (blue). The fluorescence changes are shown in B (white arrows) and in Fig. 2A (red arrow). (Scale bar: 20 µm.) (B) Data traces from one mouse during 15-s, 0.5-Hz stimulation. Each black line indicates stimulations; the yellow area marks the stimulation period. The fluorescence changes are given in percentage of baseline Ca2+ activity (ΔF/F0).

