Fig. 7.
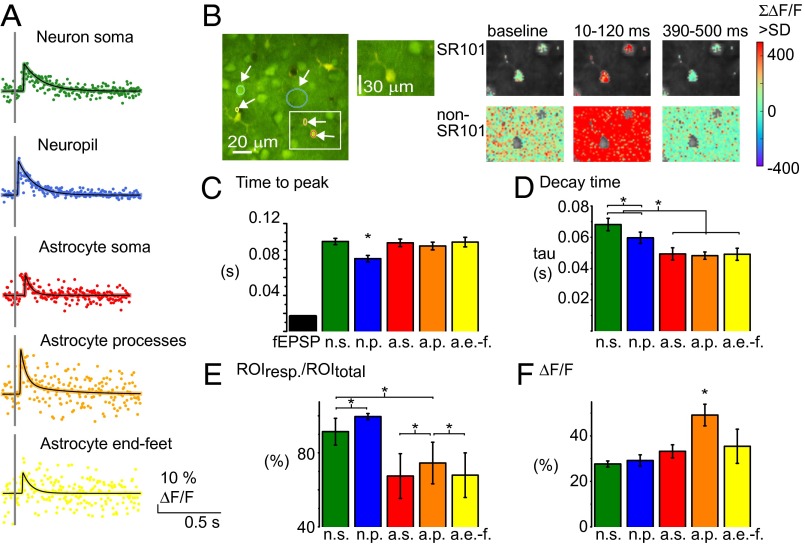
Fast Ca2+ signals exist both in neurons and astrocytes but diverge with respect to size, amplitude, prevalence, and timing. (A) Examples of Ca2+ signals from five different ROI types. Colored dots represent data points collected at different times after repeated stimuli. Black lines represent the fitted, interpolated signal. Scale bars depict fluorescence changes in percentage of the baseline activity (ΔF/F). (B) Time series of 2-PM images taken in cortical layers II/III in whisker-barrel cortex bulk-loaded with OGB (green) and surface-loaded with SR101 (red). ROIs shown in B: neuronal soma (green), neuropil (blue), astrocytic soma (red), astrocytic process (orange), and astrocytic end-feet (yellow). Sum of Ca2+activity, significantly higher than in the baseline period (>2 FSD), in 110-ms periods before, during, and after the fast Ca2+ response. Statistically significant responses are shown in the Upper row for astrocytic and Lower row for nonastrocytic (neuronal/neuropil) areas. A structure was defined as astrocytic if the SR101 staining was >2 SD of the level in the entire image and if <2 SD classified as non-SR101 pixels. Pixels not evaluated are gray in the images. (C) Mean latency of peak of Ca2+ signal and fEPSP during whisker-pad stimulation. The evoked fEPSP preceded the Ca2+ signals by 60–80 ms, and the neuropil peaked ∼20 ms before other cellular structures (P < 0.001; n = 32 animals). (D) Decay time (tau) of the fast Ca2+ responses in different ROIs. The fast Ca2+ signal lasted longest in neuron soma and neuropil (n = 32 animals, 1-Hz stimulation). (E) The percentage of ROIs responding with a fast Ca2+ signal at 1-Hz stimulation (>2 FSD). Same color code as in D (n = 15 animals). Error bars in SE of proportions. (F) Amplitude of Ca2+ activity in % of baseline. The mean maximum of the ROIs with Ca2+ signal >2 FSD shows the signal to be of equal size in astrocytic and neuronal structures (n = 15 animals). All error bars represent SEM; for number of ROIs included, see Table 1.

