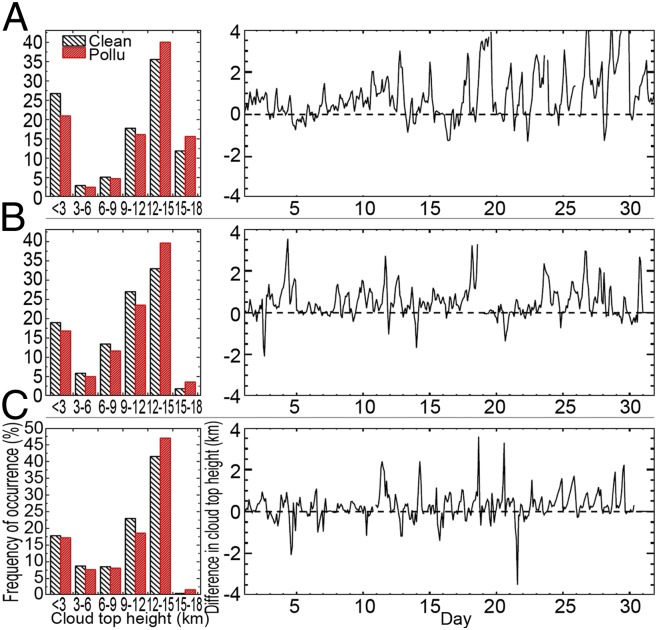
Fig. 5.
CTH for (A) TWP, (B) SEC, and (C) SGP. The left column shows the occurrence frequency of clouds for different CTHs from the clean (black striped) and polluted (red) conditions. The right column shows time series of the differences in CTH between the polluted and clean conditions (polluted − clean). Positive (negative) values indicate increases (decreases) in CTH.

