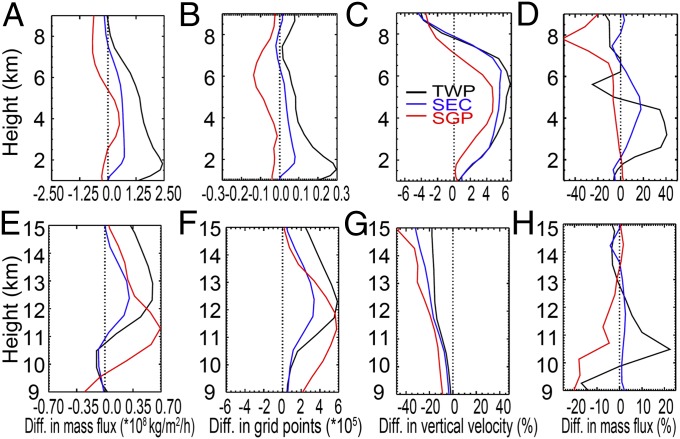
Fig. 7.
Vertical profiles of the differences of (A) updraft mass fluxes, (B) number of updraft grid points, and (C) updraft velocity (w) between the polluted and clean conditions for TWP (black), SEC (blue), and SGP (red) from 1 to 9 km. (E–G) The same as A–C but for the 9- to 15-km altitude. Values in A–C are calculated on the cloudy points with w > 1 m⋅s−1 and on the cloudy points with w > 0 m⋅s−1 in E–G. (D and H) The corresponding horizontal mass fluxes (i.e., convergence × air density). The quantities shown for the lower and middle troposphere (A–D) indicate the convection intensity of DCCs. Use of w > 1 m⋅s−1 is to exclude the noise from natural variability and shallow clouds to better represent convection intensity. However, use of w > 1 m⋅s−1 at upper troposphere will exclude great amount of stratiform/anvil clouds; thus, w > 0 m⋅s−1 is used.

