Fig. 5.
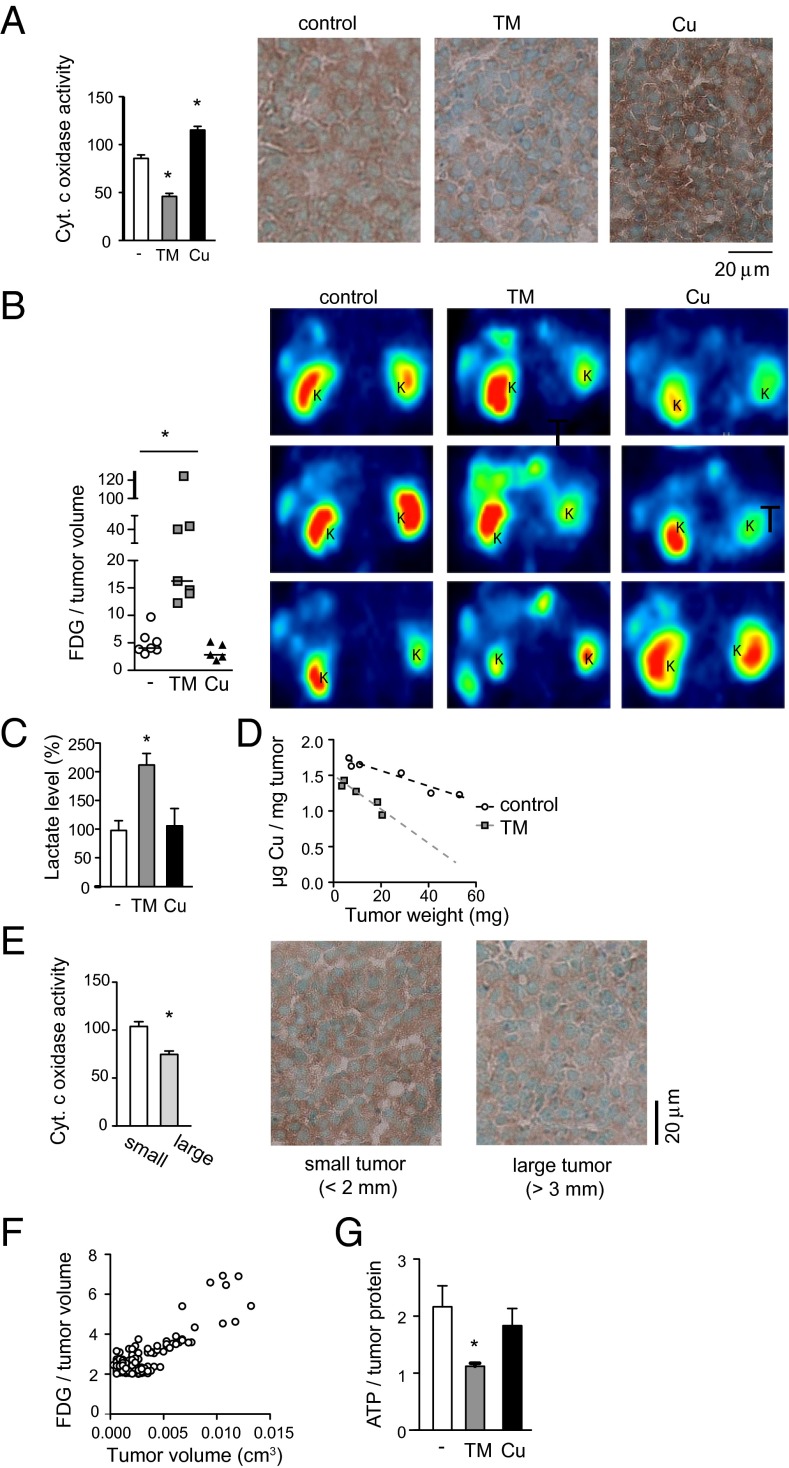
ATP levels are reduced in copper-deficient tumors despite enhanced glycolysis. (A) Cytochrome c oxidase activity of tumors following TM or copper treatment. Data are means and SEM (n > 30). *P < 0.05. (B) PET imaging of RIP1–Tag2 mice using 18FDG. Horizontal bars in the graph represent median. Representative images are shown from three mice per treatment group. 18FDG-positive tumors appear as green ∼ yellow signals. K, kidney. *P < 0.05. (C) Lactate levels in tumors treated with TM or copper. Data are means and SEM (n = 5). *P < 0.05. (D) Copper concentration in tumors according to tumor weight. (E) Cytochrome c oxidase activity in small (<2 mm) vs. large (>3 mm) tumors. Data are means and SEM (n > 20). *P < 0.05. (F) 18FDG concentrations in tumors according to tumor volume. (G) ATP levels in tumors treated with TM or copper. Data are means and SEM (n = 5). *P < 0.05.

