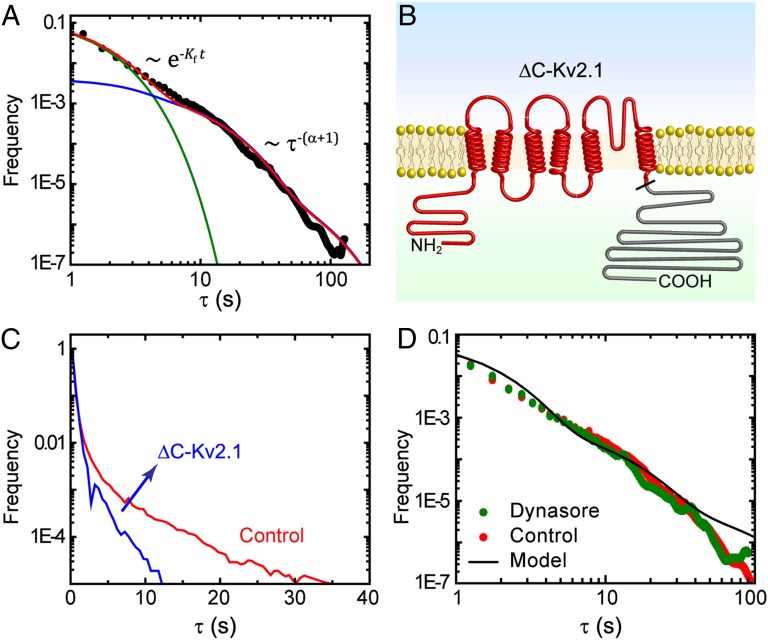
Fig. 5.
Binding-time distributions of Kv2.1. (A) Measured binding-time distribution of Kv2.1 into CCPs, round full circles. The contribution of fast-escaping channels is shown as a green solid line and slowly escaping channels in blue, along with the overall distribution in red (Eq. 4). (B) Schematic of ΔC-Kv2.1 mutant channel. The black tick marks where the C terminus (grayed) is removed. (C) Binding-time distribution for ΔC-Kv2.1. Without the C terminus, Kv2.1 becomes captured into CCPs less frequently, and it only remains bound for short times. (D) Binding-time distribution of Kv2.1 after inhibition of the GTPase dynamin with 80 μM dynasore. No statistically significant changes in the binding-time distribution are observed between control cells and dynasore-treated cells.

