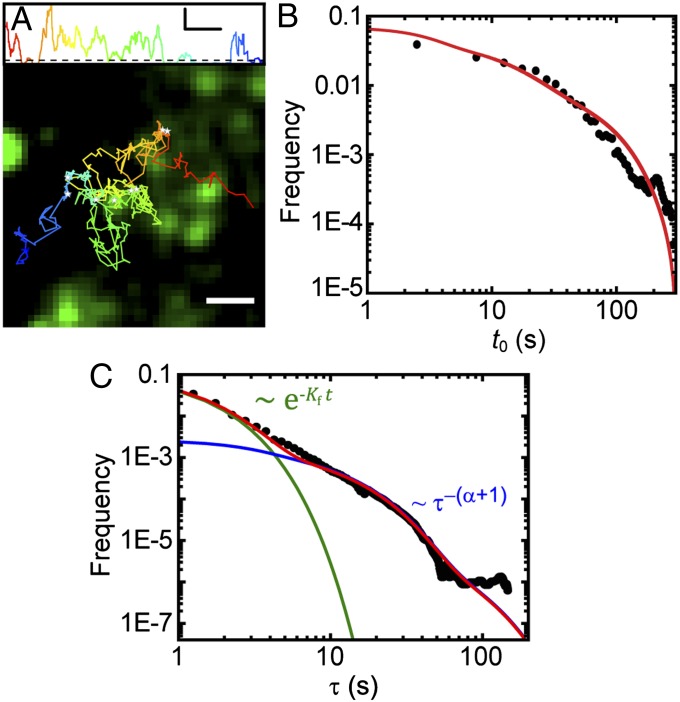
Fig. 6.
Analysis of Kv1.4 binding to CCPs. (A) Trajectory of an individual Kv1.4 channel together with the stalls of Kv1.4 longer than 1 s (white stars). Stalls for Kv1.4 also colocalize to CCPs, with 82% (n = 1,065) of all stalls occurring within a CCP. Sliding window MSD with a window length of 20 frames is shown above. The dotted line is a threshold indicating portions of the trajectory where the channel is moving (above threshold) or stalling (below threshold). (Scale bar: 0.02 μm2/s and 20 s.) Color of MSD and trajectory represent timescale, beginning at red and ending at blue. (B) Measured times of capture within a CCP together with the analytical probability distribution (Eq. 2) with B = 20 s. (C) Measured binding-time distribution for Kv1.4 shown with the model prediction. Contributions of fast (green)- and slow (blue)-escaping channels are shown along with the overall probability (red) (Eq. 4).

