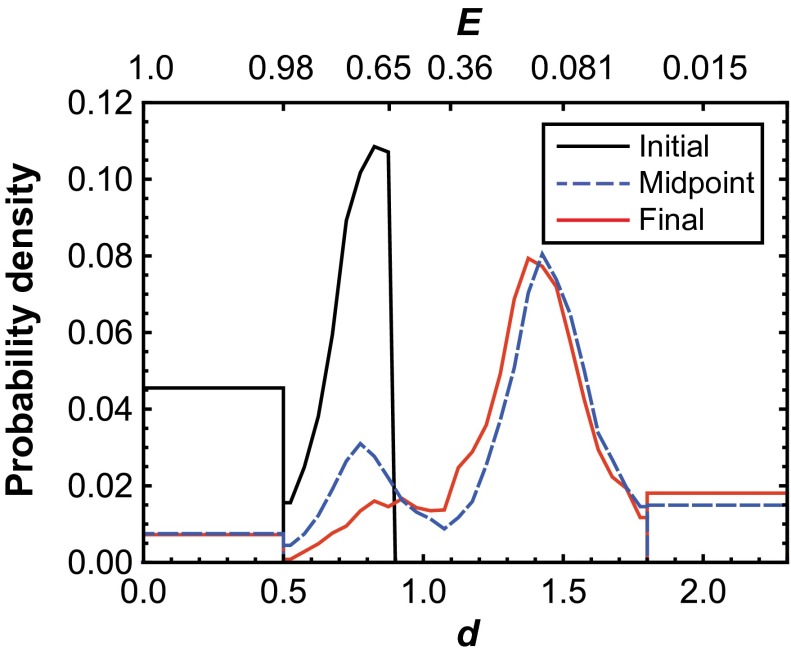
Fig. 2.
Distribution of the relative fluorophore-to-fluorophore distance (d) of OPH on FS surfaces immediately after adsorption (initial), at the midpoint of each trajectory (midpoint), and immediately before desorption (final). The “box-like” ends of each distribution represent the fraction of molecules that presented near-zero intensity in one channel or the other, leading to apparent d-values either near zero or that tended to infinity. Corresponding values of apparent FRET efficiency (E) are provided on the secondary axis.

