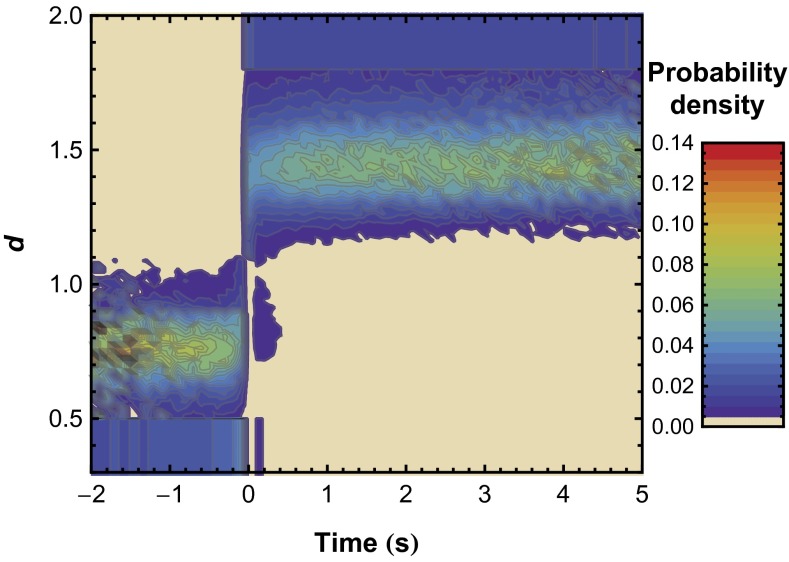
Fig. 4.
Distribution of the probability of d as a function of time constructed from individual trajectories. Time = 0 represents the first observation of the unfolded state for each trajectory, and extreme d-values (d ≤ 0.5 and d ≥ 1.8) were placed into a single bin. The probability distribution in the d-direction integrates to 1 at any given time.

