Fig. 1.
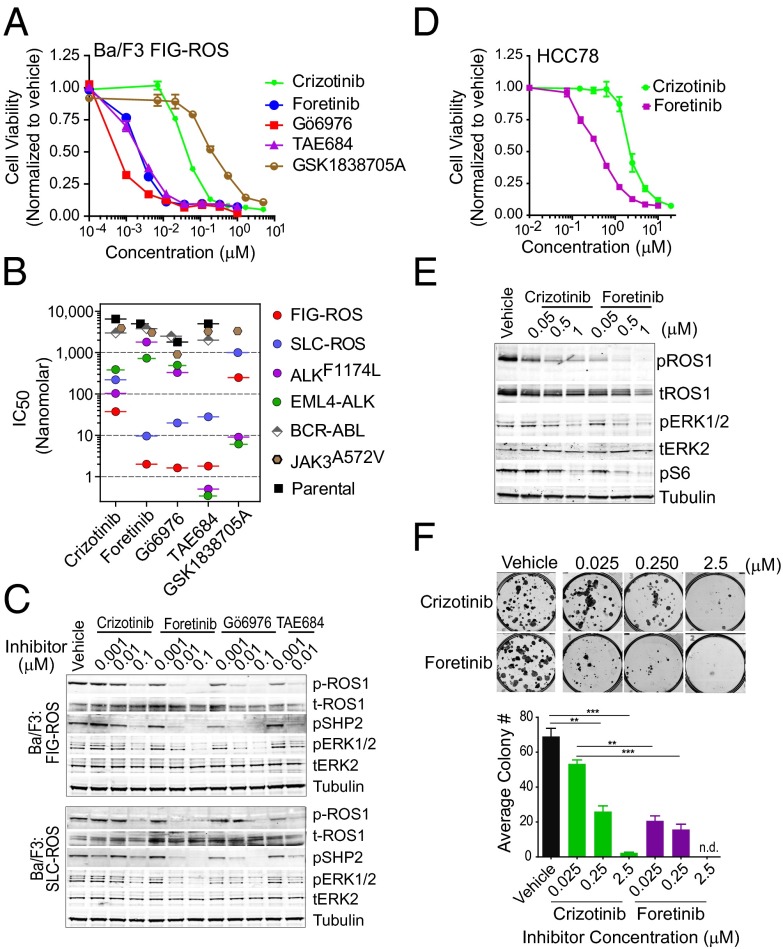
Foretinib inhibits ROS1 fusions in Ba/F3 and HCC78 cells. (A) Growth of Ba/F3 FIG–ROS cells after 72 h exposure with varying concentrations of crizotinib, foretinib, Gö6976, TAE684, and GSK1838705A as normalized to vehicle-treated cells. The values are means ± SEM from three independent experiments performed in triplicate. (B) IC50 values for the Ba/F3 FIG–ROS, SLC–ROS, EML4–ALK, ALKF1174L, BCR–ABL, JAK3A572V, and parental cells treated with the indicated inhibitors as determined from nonlinear regression curve fit analysis of the dose–response curves. (C) Immunoblot analysis of ROS1 fusion proteins and their downstream effectors after inhibitor treatment. (D) Growth of HCC78 cells after 72 h exposure with varying concentrations of crizotinib and foretinib. The normalized values are means ± SEM from three independent experiments. (E) Immunoblot analysis of SLC–ROS, ERK1/2, and protein S6 phosphorylation after inhibitor treatment in HCC78 cells. (F) Representative images and quantification of the number of colonies formed by HCC78 cells plated with or without increasing concentration of crizotinib and foretinib after 10 d. Immunoblots shown in C and E are cropped images representative of three independent experiments. Where indicated, **P < 0.01 and ***P < 0.001 by t test.

