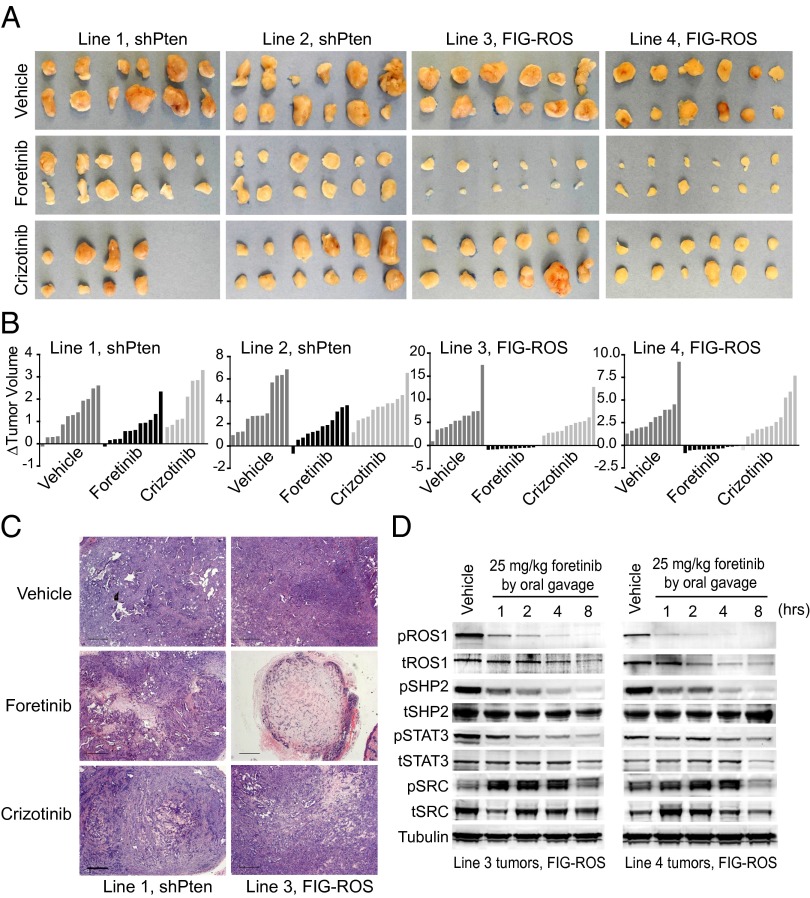
Fig. 3.
Foretinib significantly reduces FIG–ROS-driven tumor burden and inhibits intratumoral FIG–ROS phosphorylation and effector pathway activation. (A) Images of explanted FIG–ROS- and shPten-driven s.c. tumors after 9 d of foretinib (25 mg/kg) or crizotinib (25 mg/kg) treatment by oral gavage. (B) Waterfall plots showing change in FIG–ROS and shPten tumor volume from treatment initiation to 24 h after administration of the last dose. Relative tumor growth was calculated as described in Methods. (C) Representative H&E stained tumor sections from line 1 (shPten) and line 3 (FIG–ROS) after 9 d of inhibitor treatment. (Scale bar, 500 μm.) (D) Immunoblot analysis of intratumoral FIG–ROS phosphorylation and downstream effector modulation in tumors harvested from vehicle- or foretinib (25 mg/kg)-treated mice at 1, 2, 4, and 8 h after oral gavage. Cropped images representative of three independent experiments are shown.

