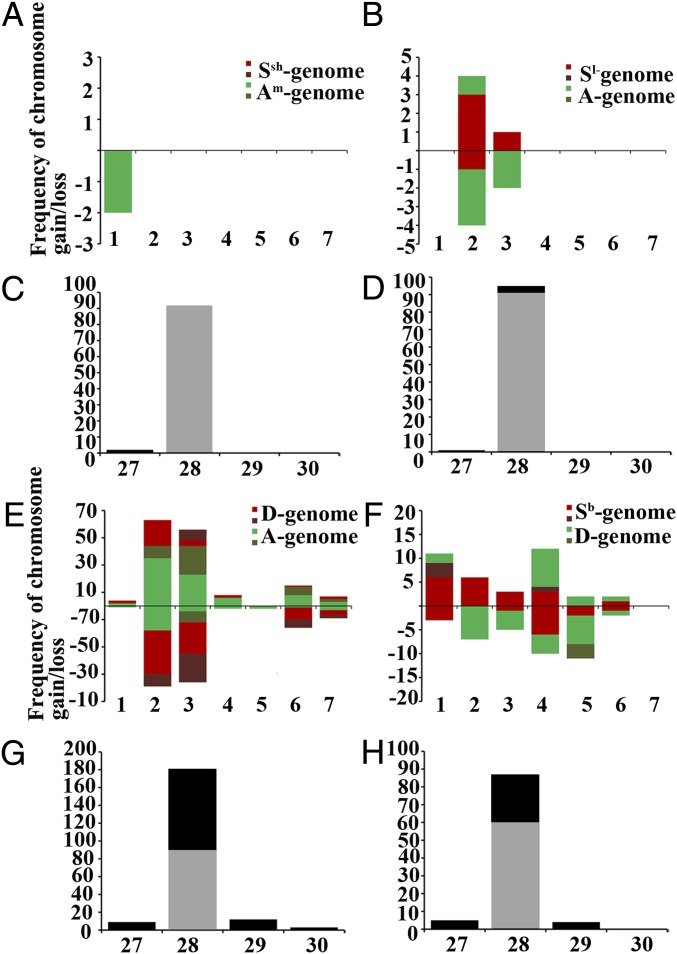
Fig. 2.
Numerical chromosome changes in a total of 489 individuals in the four synthetic allotetraploid wheats based on sequential FISH/GISH karyotyping. (A, B, E, and F) Propensities for gain/loss of individual chromosomes of each of the seven homeologous groups (bars 1–7 on the x axis) and the numbers of aneuploid chromosomes of each of the seven homeologous groups observed in the four combinations are shown on the y axis. Depiction via stacked bar chart in A, B, E, and F is according to ref. 21, whereby chromosome loss and gain of either one homolog (lighter colors) or both homologs (darker colors) are shown below and above the x axis, respectively. (C, D, G, and H ) The x axis represents the chromosome counts in euploids/compensated aneuploids (2n = 28) and other aneuploids with 2n = 27, 29, and 30, and the y axis represents total number of plants showing a particular ploidy. The black and gray portions of the 2n = 28 bars denote for compensated aneuploidy and euploidy, respectively. A and C, B and D, E and G, and F and H are AT1, AT2, AT3, and AT4, respectively.

