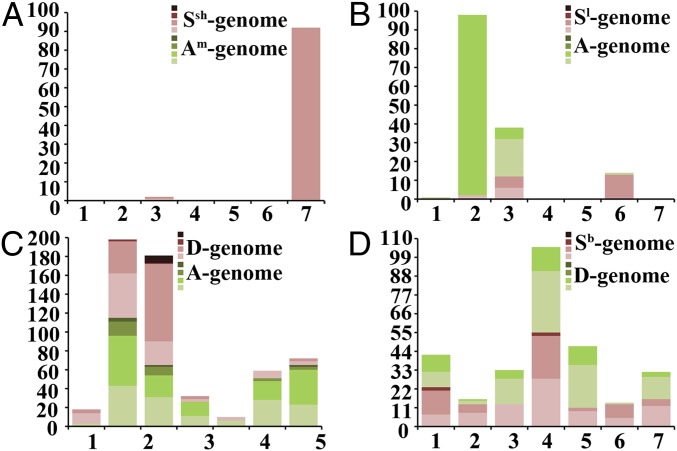
Fig. 3.
Structural chromosome changes in a total of 489 individuals in the four synthetic allotetraploid wheats based on sequential FISH/GISH karyotyping. Propensities for restructuring (intergenomic reciprocal rearrangements or unidirectional homeologous transfer) by each of the seven homeologous groups (bars 1–7 on the x axis; numbers of restructured chromosomes appear on the y axis) are shown in the stacked bar chart. The severity of restructuring for a given chromosome is indicated by color intensity at four scales, from lightest to darkest denoting the number of restructured copies for a given chromosome ranging from one copy (a single homolog restructured), two (both homologs restructured), three (all three homologs in trisomy restructured), and four (all four homologs in tetrasomy restructured). A, B, C, and D are AT1, AT2, AT3, and AT4, respectively.

