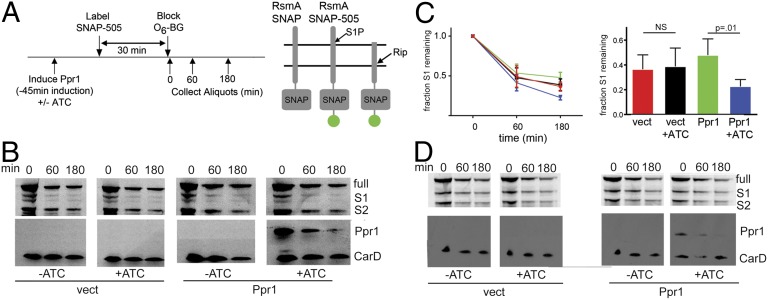
Fig. 5.
Ppr1 accelerates Rip1 cleavage of S1-cleaved RsmA. (A) Experimental Schematic. ATC induces expression of HA-Ppr1. A control strain carries an ATC-inducible vector without Ppr1 sequences. At time −30 min, cells are labeled with SNAP-505, which labels SNAP-tagged proteins covalently, for 30 min. SNAP-505 labeling is terminated by addition of O6 benzylguanine (O6-BG). Aliquots are taken at time 0, 60 min, and 180 min, and protein lysates are prepared. The right side of A depicts the full-length RsmA-SNAP, full-length RsmA-SNAP 505, and S1P-cleaved RsmA-SNAP 505, which is the substrate for Rip1. (B) Kinetics of RsmA degradation with and without Ppr1. Protein lysates from WT M. smegmatis expressing RsmA-SNAP and either vector (JSS182) (left blots) or ATC-inducible Ppr1 (JSS183, right blots) were prepared at the indicated time points and separated by SDS/PAGE. Fluorescently labeled RsmA-SNAP was detected by gel fluorometric scanning (upper blots). The positions of full-length RsmA-SNAP, S1P-cleaved RsmA-SNAP (S1) and the S2P-cleaved product (S2P) are indicated at the side of the gel image. Ppr1 protein was detected by immunoblotting with anti-HA antibodies and protein loading was normalized using antibodies to CarD. (C) The normalized fraction of RsmA-S1 over time in vector –ATC (red), vector +ATC (black), Ppr1 –ATC (green), and Ppr1 +ATC (blue). Error bars are SEM, and each point is the mean of four independent experiments. The bar graph depicts data from the 180-min time point. (D) The accelerated degradation of RsmA-S1 by Ppr1 is dependent on Rip1. The experimental design is identical to B, but the parent strain is M. smegmatis Δrip1.

