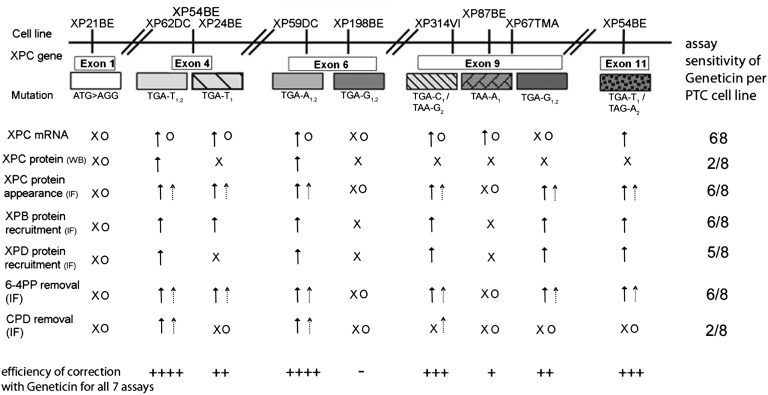
Fig. 6.
Summary of assays and XP-C PTC readthrough results. Summary of XP-C cell lines tested (top row), the type of PTC mutation in the XPC gene, the assays used to assess various steps of the post-UV NER pathway (first column: IF, immunofluorescence; WB, Western blot), the response to Geneticin and gentamicin in each assay, and summary assay sensitivity of the eight PTC cell lines for Geneticin (last column). The efficiency of correction with Geneticin for all seven assays (bottom row) is indicated by ++++ positive in seven assays, +++ positive in five assays, ++ positive in four assays, + positive in one assay, and – none.  , Geneticin response;
  , gentamicin response; x, no response to Geneticin; O, no response to gentamicin.

