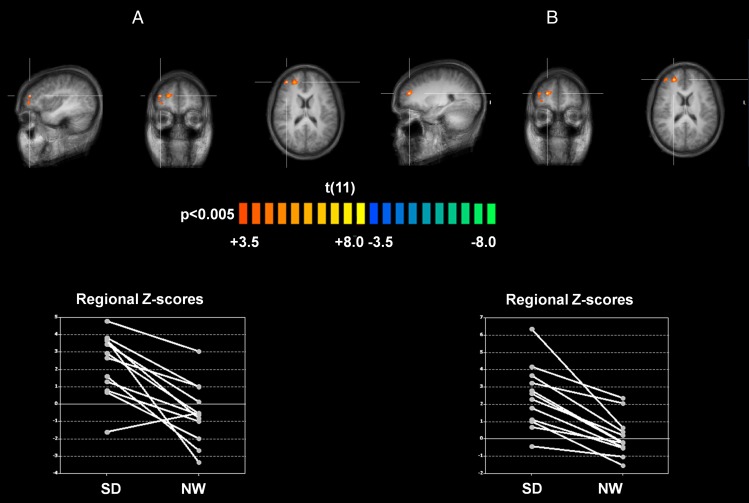
Fig. 4.
The contrast of the two conditions shows an increased connectivity between the DN seed and two areas (A) on the right middle (BA 10, DLPFC, spot 1: coordinates: +38, +46, +18; z score = 3.5413, significance = 0.000498; cluster size = 324 mm) and (B) on the right superior frontal gyrus (BA 10, DLPFC; spot 2: coordinates: +23, +46, +18; z score = 4.202, significance = 0.000026; cluster size = 1,092 mm) after SD compared with NW.

