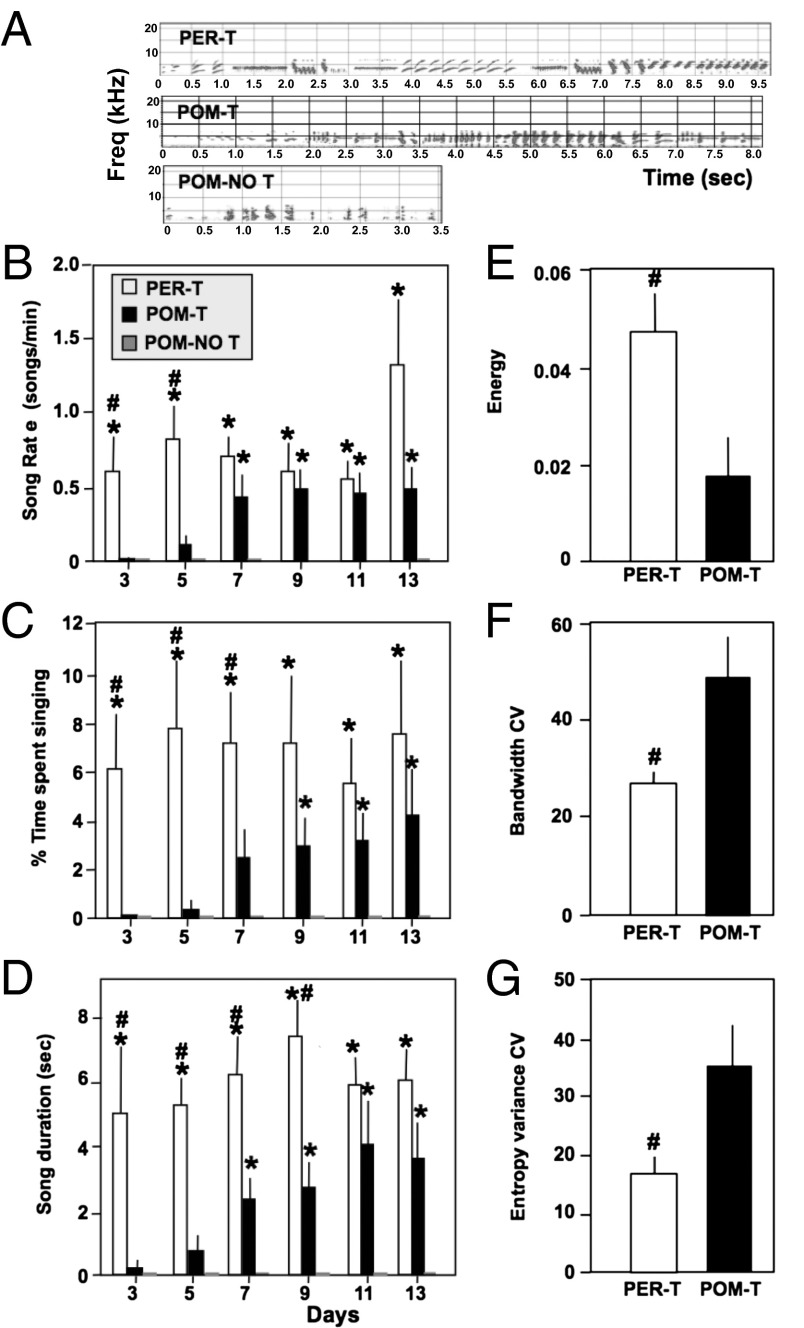
Fig. 2.
Effect of treatments on song rate, duration, and quality. (A) Representative spectrograms of song from each group. (B–G) Effects of T treatment on various song measures. B–D show the effects of treatment on measures of song rate and duration; E–G represent average quality features of song. *P < 0.05 vs. POM-NO T; #P < 0.05 vs. POM-T.

