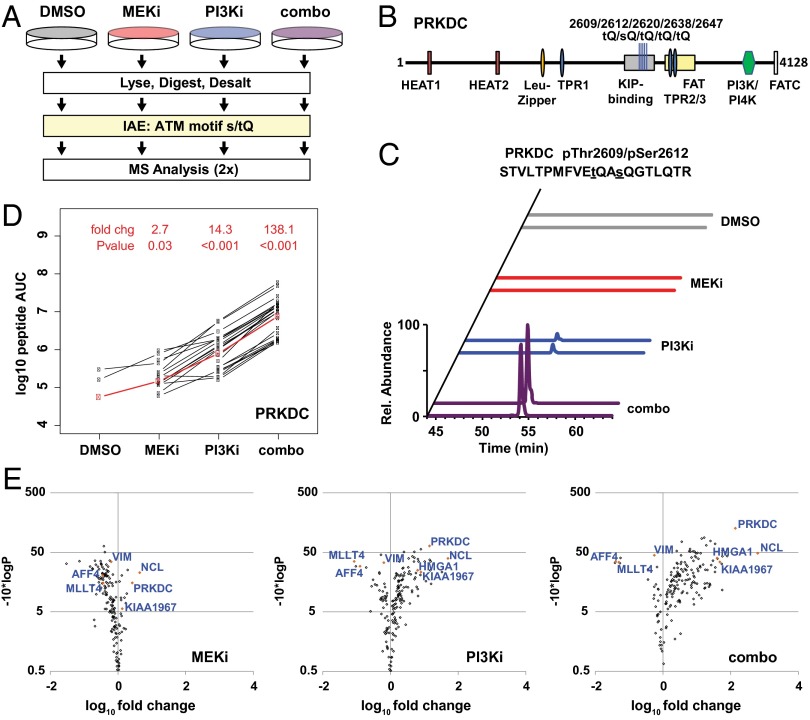
Fig. 2.
Characterization of DDR signaling by LC-MS/MS and LiME analysis. (A) Diagram of IAE and MS analysis of [s/t]Q motif phosphopeptides in the combined-effects experiment. (B) PRKDC protein (4,128 residues), including domains and the five [s/t]Q phosphorylation sites from the combined-effects experiment. (C) Normalized extracted ion chromatograms (± 10 ppm) for duplicate injections of 819.0374 m/z ion from PRKDC pThr2609/pSer2612. (D) LiME plot showing label-free AUC for peaks from each phosphopeptide (black lines). The LiME model is shown in red. Fold changes and P values are reported for each treatment (MEKi, PI3Ki, or combo) relative to DMSO treatment. (E) LiME data displayed as volcano plots. The log10 fold change versus T−10*log10 (P value) is shown for each protein in a treatment group (MEKi, PI3Ki, or combo) relative to DMSO treatment. Selected proteins are identified, including several top hits denoted by orange symbols.

