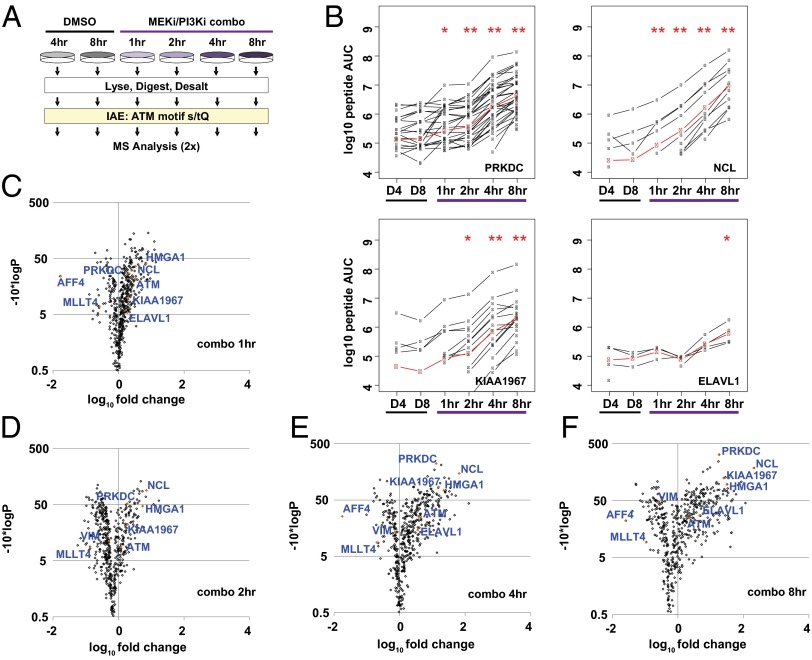
Fig. 3.
Temporal profiling of DDR signaling upon MEK/PI3K dual inhibition. (A) Diagram depicting IAE of [s/t]Q motif phosphopeptides and MS analysis in the time course. (B) LiME plots for PRKDC, NUCL, K1967, and ELAV1 in each sample (black lines). The LiME model (red) was used to determine protein-level fold changes and P values relative to 4-h DMSO treatment (D4). *P < 0.01, **P < 0.001 relative to 4-h DMSO. (C–F) LiME data for 1-, 2-, 4-, and 8-h combo samples displayed as volcano plots vs. 4-h DMSO treatment. Selected proteins are identified, including several top hits denoted by orange symbols.

