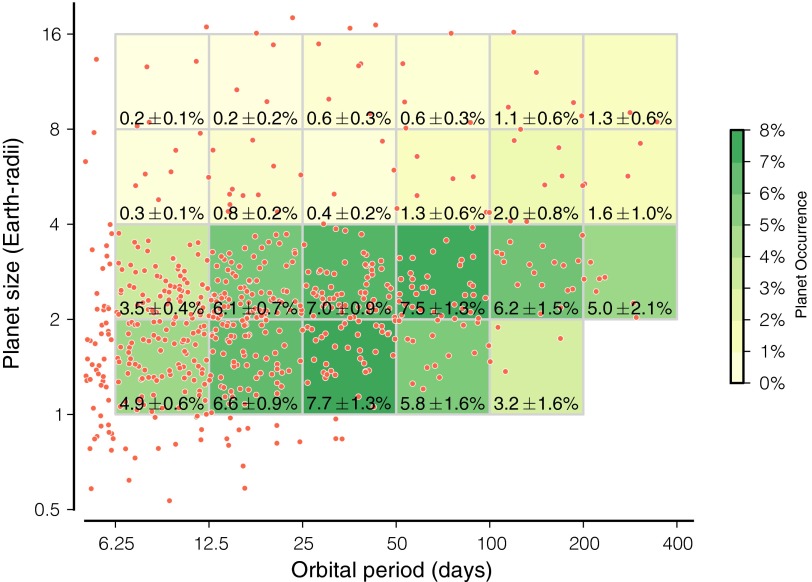
Fig. 2.
Planet occurrence,  , as a function of orbital period and planet radius for P = 6.25–400 d and
  . As in Fig. 1, detected planets are shown as red circles. Each cell spans a factor of 2 in orbital period and planet size. Planet occurrence in a cell is given by
  , where the sum is over all detected planets within each cell. Here,
  is the number of nontransiting planets (for each detected planet) due to large tilt of the orbital plane,
  is the detection completeness factor, and
  stars in the Best42k sample. Cells are colored according to planet occurrence within the cell. We quote planet occurrence within each cell. We do not color cells where the completeness is less than 25%. Among the small planets, 1–2 and 2–4
  , planet occurrence is constant (within a factor of 2 level) over the entire range of orbital period. This uniformity supports mild extrapolation into the P = 200–400 d,
  domain.

