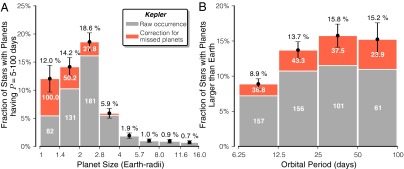
Fig. 3.

The measured distributions of planet sizes (A) and orbital periods (B) for  and P = 5–100 d. Heights of the bars represent the fraction of Sun-like stars harboring a planet within a given P or RP domain. The gray portion of the bars show planet occurrence without correction for survey completeness, i.e., for
  . The red region shows the correction to account for missed planets, 1/C. Bars are annotated to reflect the number of planets detected (gray bars) and missed (red bars). The occurrence of planets of different sizes rises by a factor of 10 from Jupiter-size to Earth-sized planets. The occurrence of planets with different orbital periods is constant, within 15%, between 12.5 and 100 d. Due to the small number of detected planets with
  and P > 100 d (four detected planets), we do not include P > 100 d in these marginalized distributions.
