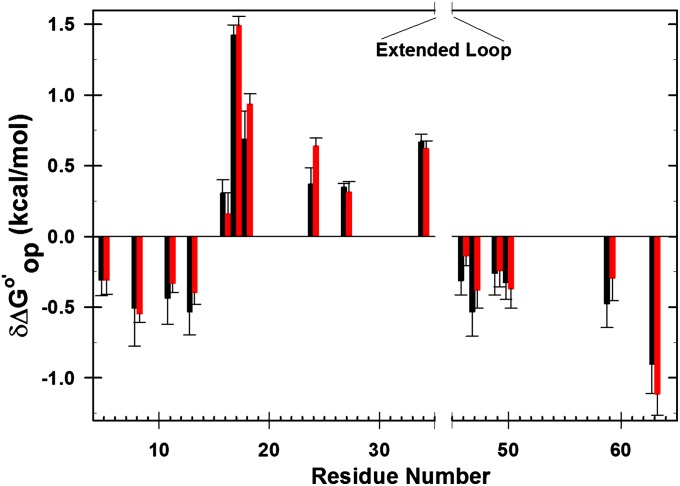
Fig. 2.
Differences in  corresponding to the vertical sides of Fig. 1. Black bars,
  in reconstituted cytosol (100.0 g dry weight/L); red bars,
  values in dilute solution. Data are shown for residues observed in both proteins whose
  values are statistically different from zero.

