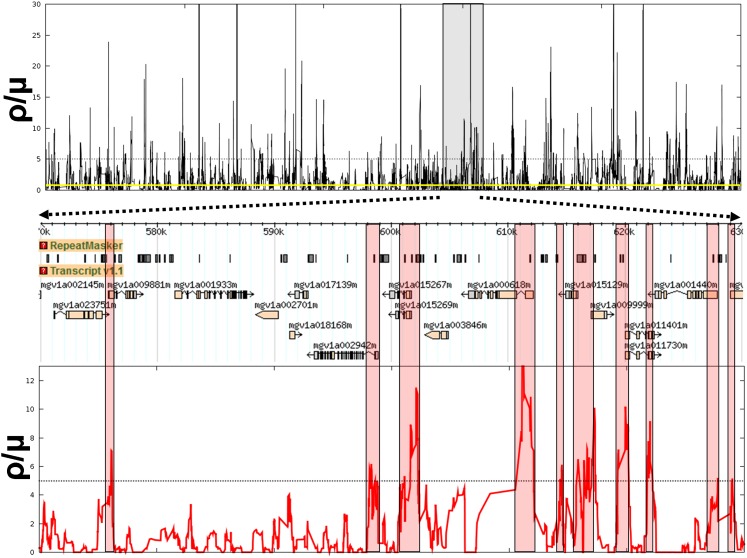
Fig. 5.
Inferred per-base recombination rate across a 1 Mbp region of the Mimulus genome (Upper) using sliding windows of 15 adjacent nonoverlapping SNP pairs. Yellow line shows genome-wide average (ρ/μ ∼ 0.8), and dashed line indicates an arbitrary cutoff at ρ/μ = 5 for hotspot detection. (Lower) A 60-kbp region, showing association of hotspots with 5′ ends of protein-coding genes.

