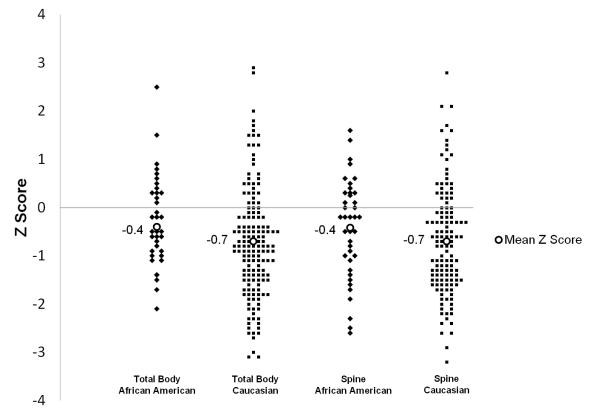
Figure 2.
Line plot graph of bone mineral density (DXA Z score) by race and total body or spine. Diamonds represent individual African American children with CD, squares are Caucasians with CD and open circles are the mean Z score in each group. Mean Z score was similar between races (−0.4 vs −0.7 for both total body and spine; p=0.104 and p=0.236).

