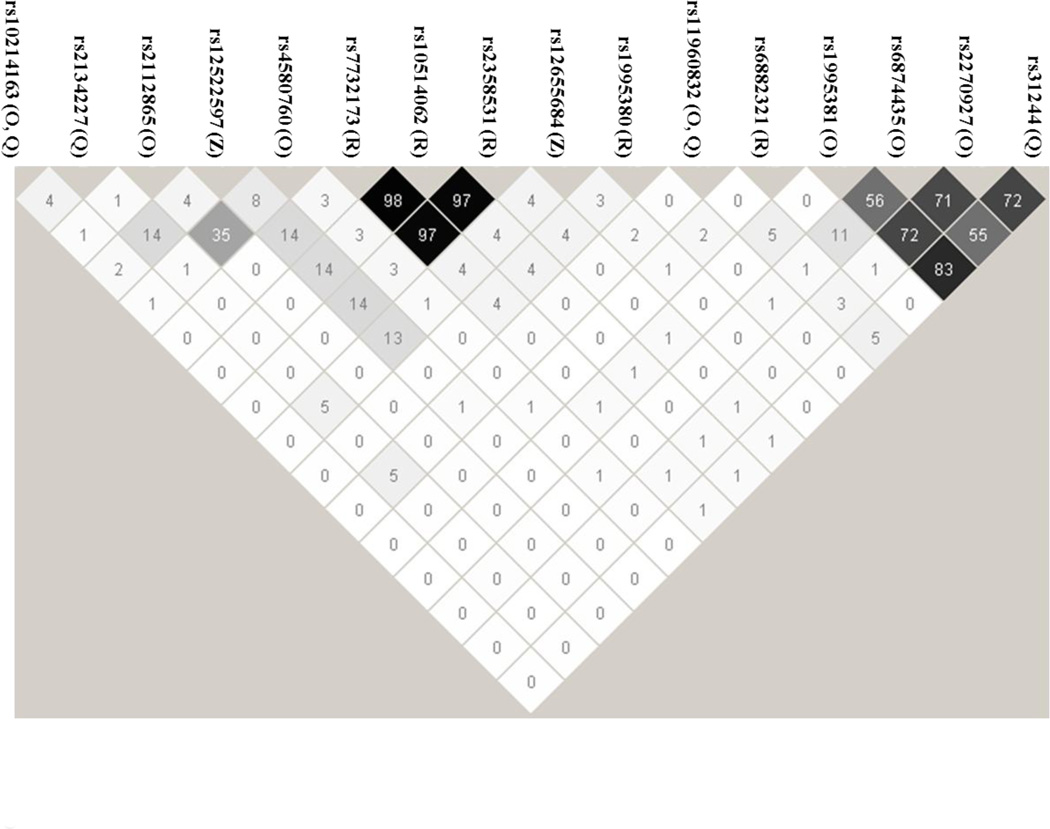
Figure 1. Linkage Disequilibrium plot of significant SNPs.
The SNPs in Table 2 were used as input for Haploview to calculate linkage disequilibrium parameters for the 16 unique SNPs in Table 2 (See Materials and Methods Section 2.3). The number inside the diamonds represents the r2 value for the given 2-SNP pair. The capital letter(s) following each rs number identifies the drug(s) for which findings are listed in Table 2 as follows: O = olanzapine; Q = quetiapine; R = risperidone; and Z = ziprasidone

