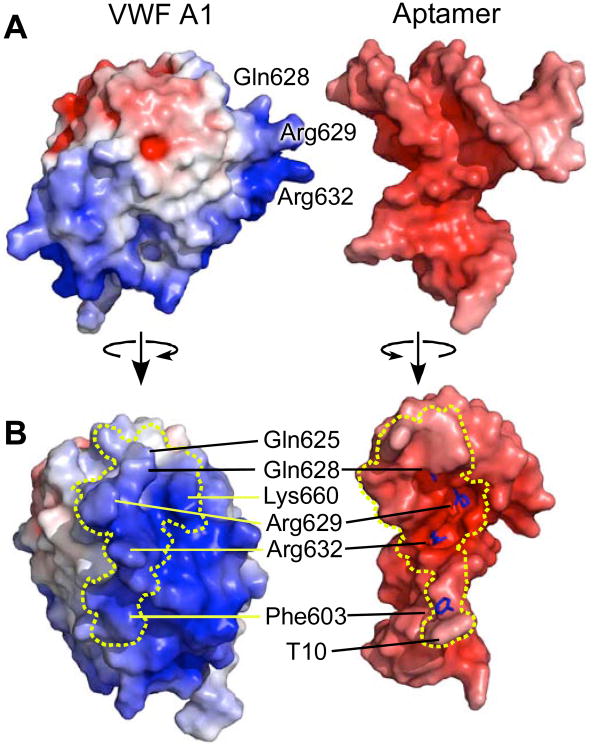
Figure 3. Interface between ARC1172 and VWF A1 domain.
(A) Surfaces of VWF A1 (left) and aptamer (right), separated for visualization and colored by electrostatic potential red (negative) to blue (positive) that are calculated with APBS (Baker et al., 2001). (B) Contacting surfaces of VWF A1 (left) and the aptamer (right) separated by less than 4.2 Å are boxed by dashed lines. Stick representations (right) show the locations of the side chains of Gln628, Arg629, Arg632, and Phe603, which play major roles within the interface. Compared to the views in panel (A), VWF A1 (left) and ARC1172 (right) were rotated approximately 90° around the vertical axis so that the binding interfaces face the viewer.

