
Figure 4.
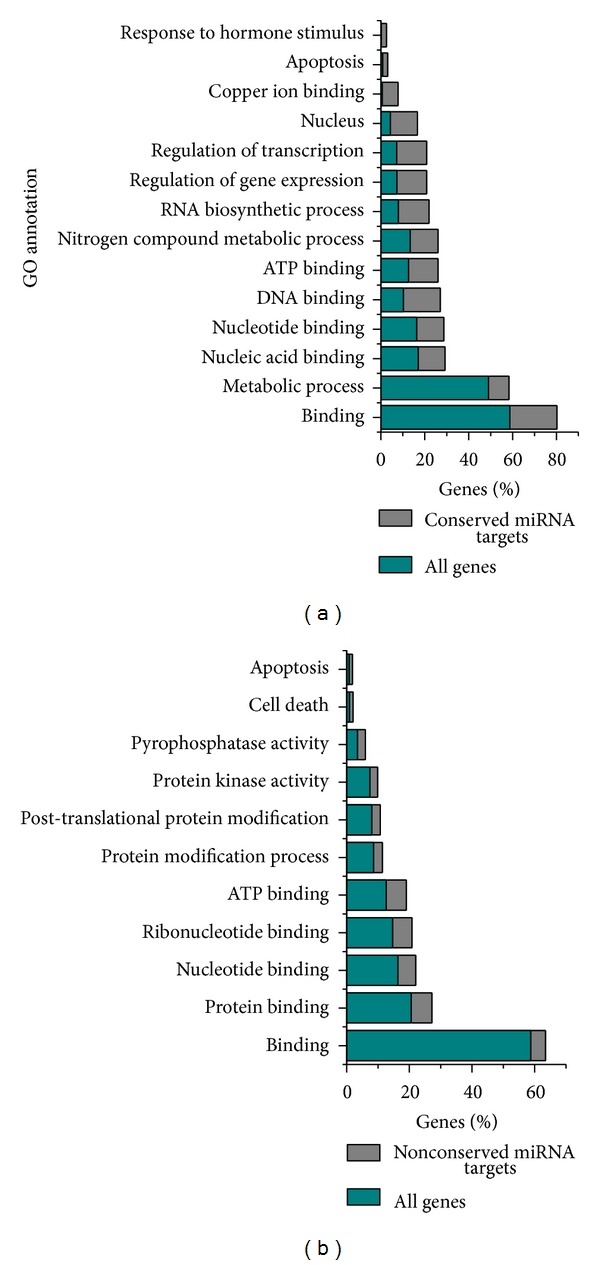
GO enrichment analysis of predicted miRNA targets. (a) Significantly overrepresented GO terms for conserved miRNAs identified in this study. (b) Significantly overrepresented GO terms for possible cassava-specific miRNAs. Cyan and gray bars indicate the fraction of miRNA targets and cassava genes annotated with a corresponding GO term, respectively. See Supplementary Tables 3 and 4 for the full list of significant terms.