
Fig. 10.
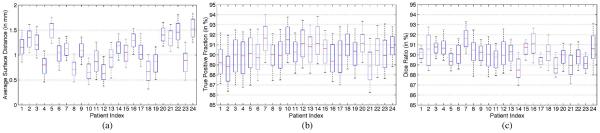
Whisker plots of (a) average surface distance, (b) true positive fraction, and (c) Dice ratio between the estimated prostate by the proposed method and the segmentation ground truth for each patient.
Official websites use .gov
A
.gov website belongs to an official
government organization in the United States.
Secure .gov websites use HTTPS
A lock (
) or https:// means you've safely
connected to the .gov website. Share sensitive
information only on official, secure websites.
Whisker plots of (a) average surface distance, (b) true positive fraction, and (c) Dice ratio between the estimated prostate by the proposed method and the segmentation ground truth for each patient.