
Fig. 19.
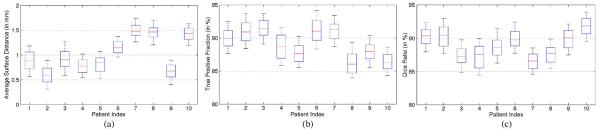
Whisker plots of (a) average surface distance, (b) true positive fraction, and (c) Dice ratio between the estimated prostate by the proposed method and the segmentation ground truth for each patient on the additional prostate CT image dataset.