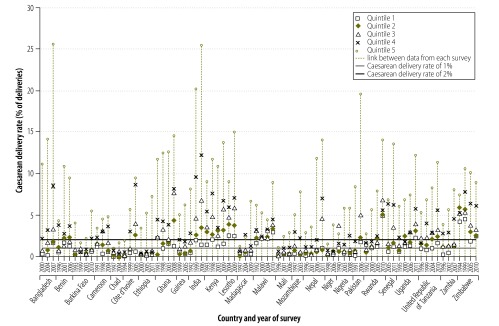
Fig. 1.
Caesarean delivery ratesa by country, survey year and wealth quintile, southern Asia and sub-Saharan Africa, 1990–2011
a As percentages of the deliveries that ended in live births.
Note: The wealth quintile to which each surveyed household belonged was categorized as 1, 2, 3, 4 or 5. Quintile 1 comprised the poorest 20% of households and Quintile 5 comprised the richest 20%.

