
Figure 3.
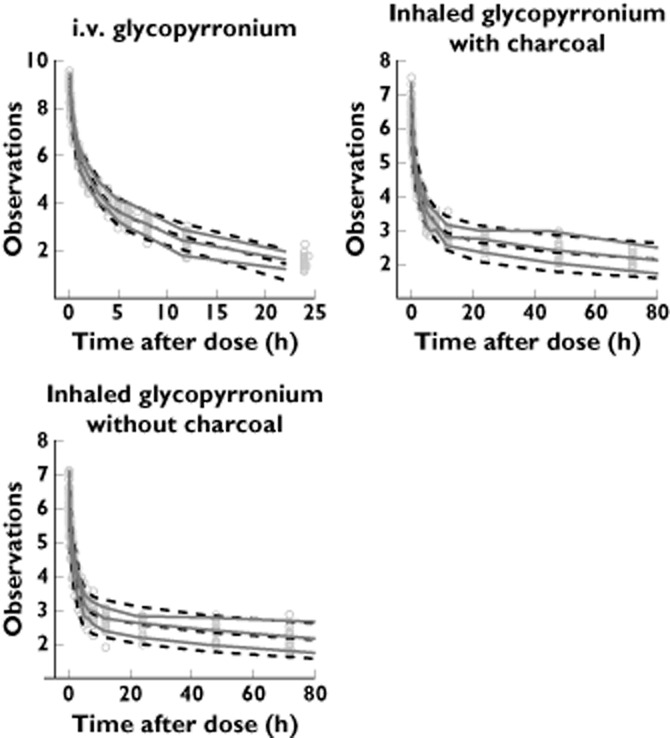
Visual predictive check. ‘Observations’ refers to the natural logarithm of the plasma concentrations of glycopyrronium (in picograms per millilitre). Time after dose is given in hours. Grey dots represent measured concentrations, continuous lines the 90% percentiles of the real data, and dashed lines the 90% prediction intervals