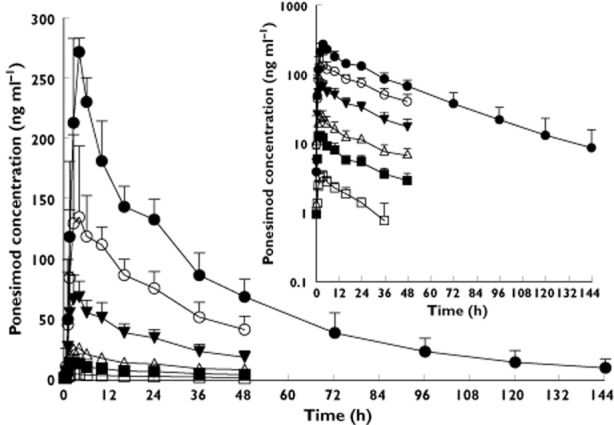
Figure 2.

Arithmetic mean (and SD) plasma concentration–time profiles of ponesimod in healthy subjects (n = 6 per dose group) after administration of single doses of 1, 3, 8, 20, 50 or 75 mg of ponesimod (linear scale). The inset shows the profiles on a semilogarithmic scale. For clarity, SD is displayed only for ponesimod doses ≥20 mg for the profiles on the linear scale.  , 1 mg;
  , 3 mg;
  , 8 mg;
  , 20 mg;
  , 50 mg;
  , 75 mg
