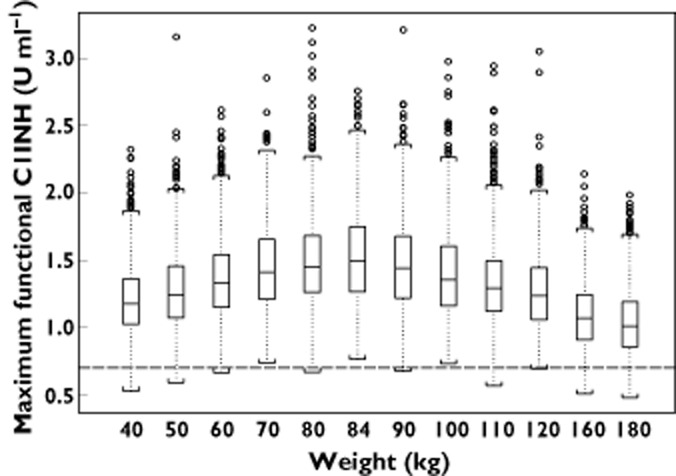
Figure 4.

Simulation of maximal functional C1INH concentration (Cmax) for levels the proposed dosing regimen of 50 U kg−1 up to 84 kg and a fixed dose of 4200 U for a bodyweight >84 kg. The boxes represent the 25th and 75th percentile with the median value. The ends of the whiskers represent 1.5 times the interquartile range from the 25th and 75th quartiles, and any observations beyond 1.5 times the interquartile range are represented as open circles. The dashed line represents the lower limit of normal C1INH activity (0.7 U ml−1)
