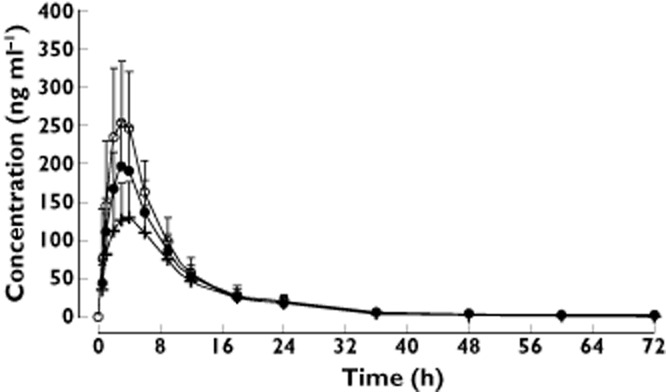
Figure 1.

Apixaban mean (+ SD) plasma concentration–time profiles in subjects with low, reference and high body weights. Body weight group:  , low (≤50 kg), n = 18;
  , reference (65–85 kg), n = 16;
  , high (≥120 kg), n = 19

Apixaban mean (+ SD) plasma concentration–time profiles in subjects with low, reference and high body weights. Body weight group:  , low (≤50 kg), n = 18;
  , reference (65–85 kg), n = 16;
  , high (≥120 kg), n = 19