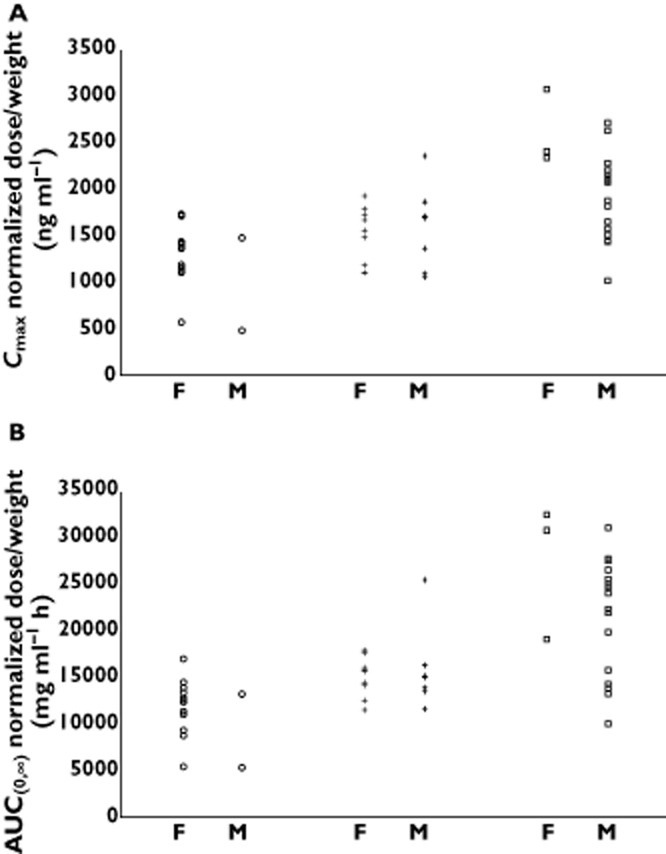
Figure 3.

Scatter plot of apixaban exposure normalized to dose and body weight showing male (M) and female (F) subjects in each body weight group for (A) maximum plasma concentration (Cmax) and (B) area under the concentration–time curve to infinity (AUC(0,∞)). Body weight group:  , low (≤50 kg), n = 18;
  , reference (65–85 kg), n = 16;
  , high (≥120 kg), n = 19
