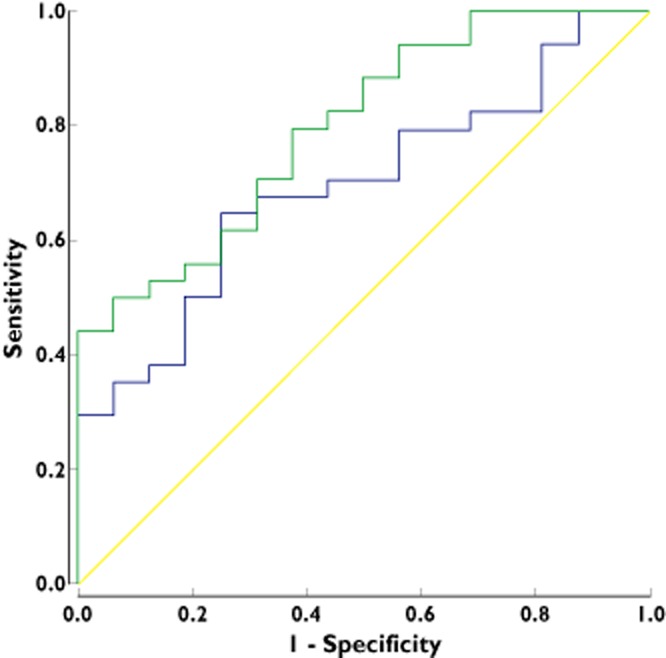
Figure 1.

ROC curve for the EULAR good response after 6 months vs. the DAS28 score at 2 weeks (AUC: 0.70: 95% CI: 0.55, 0.84) and after 6 weeks (AUC: 0.80: 95% BI: 0.67, 0.92).  , DA28 at 2 weeks;
  , DA28 at 6 weeks;
  , Reference line

ROC curve for the EULAR good response after 6 months vs. the DAS28 score at 2 weeks (AUC: 0.70: 95% CI: 0.55, 0.84) and after 6 weeks (AUC: 0.80: 95% BI: 0.67, 0.92).  , DA28 at 2 weeks;
  , DA28 at 6 weeks;
  , Reference line