
Fig. 2.
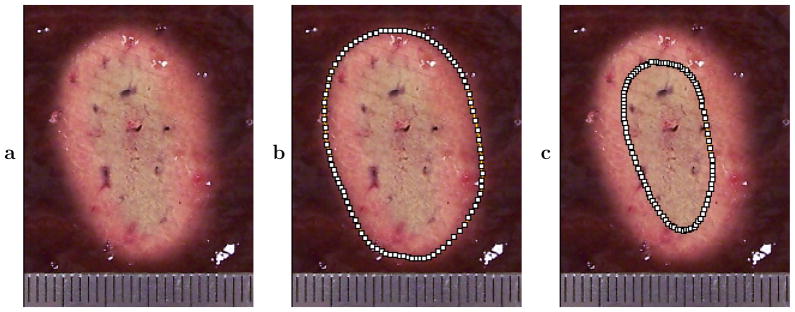
Representative cross section of treated bovine liver tissue from one of the 1.4 MPa exposures, showing segmentation of ablated regions (all coagulated tissue) and overtreated regions (brown cores of some lesions). This cross section was taken parallel to the tissue surface (perpendicular to the image plane) at a depth of 8 mm. The ruler shown is scored at 1 mm intervals. (a) Treated cross section. (b) Segmented area of complete ablated region. (c) Segmented area of inner, overtreated region.