
Fig. 4.
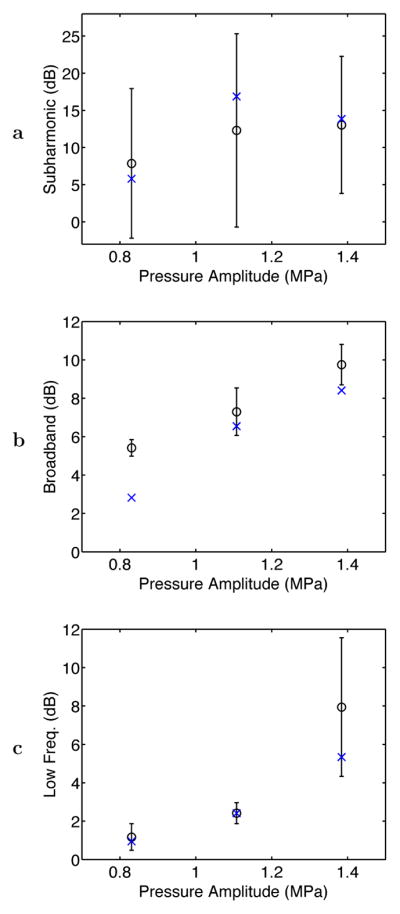
Average levels for PCD-measured acoustic emissions within subharmonic, broadband, and low-frequency intervals at the three exposure conditions employed. Plotted as circles with error bars are the mean and standard deviation of the average emission level for each pressure amplitude (N = 6 for each). The plotted “x” symbols show average acoustic emission levels in each band for two experiments without the needle thermocouple at each exposure condition.