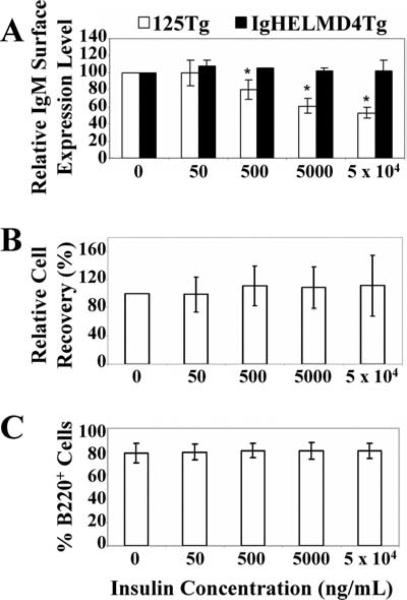
FIGURE 3.
Immature anti-insulin B cells down-regulate IgM surface expression upon insulin encounter in vitro and do not undergo clonal deletion. A, Flow cytometry to show IgM expression levels. The IgM mean fluorescence intensity of cells cultured in the absence of Ag was normalized to 100% and the relative IgM surface expression level was determined for cells cultured with human insulin (e.g., 50 ng/ml insulin IgM mean fluorescence intensity ÷ 0 ng/ml insulin IgM mean fluorescence intensity × 100% = relative IgM expression). The average of three (IgHELMD4Tg, ■) or 15 (125Tg, □) experiments is shown ± SD, *, p < 0.0005, as calculated by a two-tailed, expected mean, one-sample t test. B, Relative cell recovery in bone marrow culture was calculated to minimize experimental differences in IL-7 stimulatory potential by dividing the human insulin-cultured cell percent recovery by the percent recovery of cells cultured without insulin in the same experiment; percent recovery was calculated by dividing the end cell number by the input cell number. The average of 18 experiments ± SD is shown. C, Histograms showing percentages of B220+ cells present at the end of the culture assessed using flow cytometry. The average of 17 experiments ± SD is shown. Ag-naive immature B cells are generated as in Fig. 2A and cells are harvested after culture with 0–5 × 10⁴ ng/ml human insulin.

