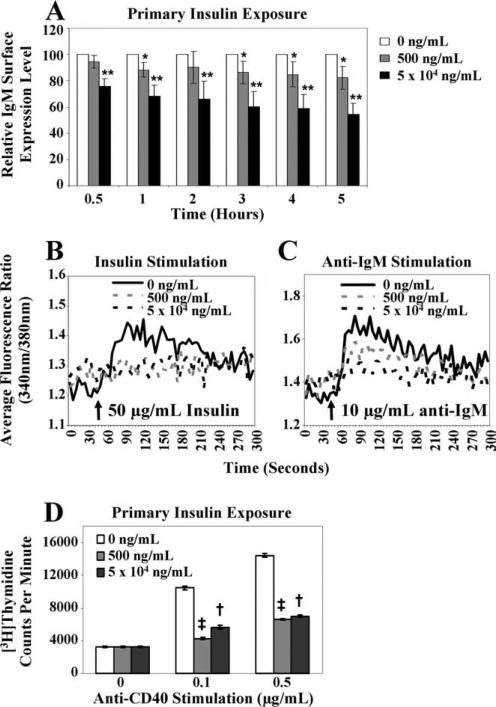
FIGURE 7.
Functional impairment is observed in anti-insulin B cells after short-term exposure to insulin. Naive immature 125Tg B cells were generated (Fig. 2). A, Flow cytometric analysis showing relative IgM surface expression levels on 125Tg cells cultured for 0.5–5 h in the presence of human insulin, as calculated in Fig. 3A. The average of seven animals ± SD is shown; *, p < 0.01 and **, p < 0.007, as calculated by a two-tailed, expected mean, one-sample t test. B and C, Intracellular Ca2+ mobilization was measured in cells cultured for 1 day with no insulin, followed by 0 ng/ml (solid black line), 500 ng/ml (dashed gray line), or 5 × 10⁴ ng/ml human insulin (dashed black line) for 3 h and stimulated with human insulin (B) or anti-IgM (C). Data are representative of more than five animals. D, [3H]thymidine incorporation (cpm) was measured. Following culture without insulin for 1 day, anti-CD40 (x-axis) and 0 ng/ml (□), 500 ng/ml ( ), or 5 × 10⁴ ng/ml (■) human insulin were added simultaneously and the cells were cultured for an additional 2 days. The average of triplicate values from three animals ± SD is shown; †, p < 0.031 and ‡, p < 0.001, as calculated by a two-tailed, two-sample/unequal variance t test.

