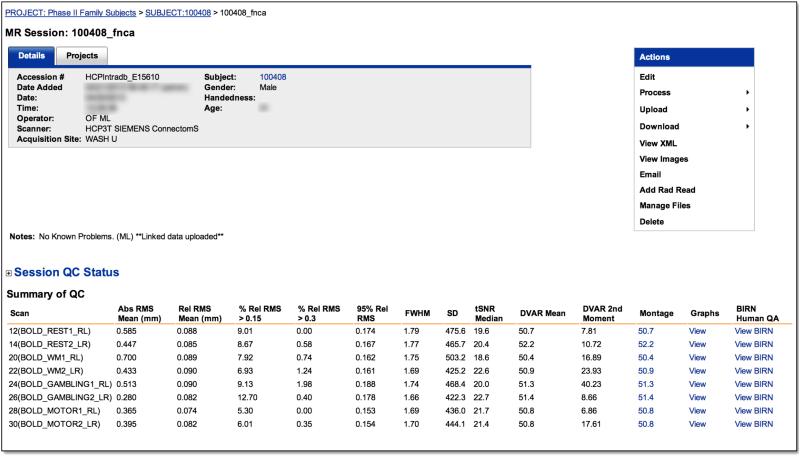
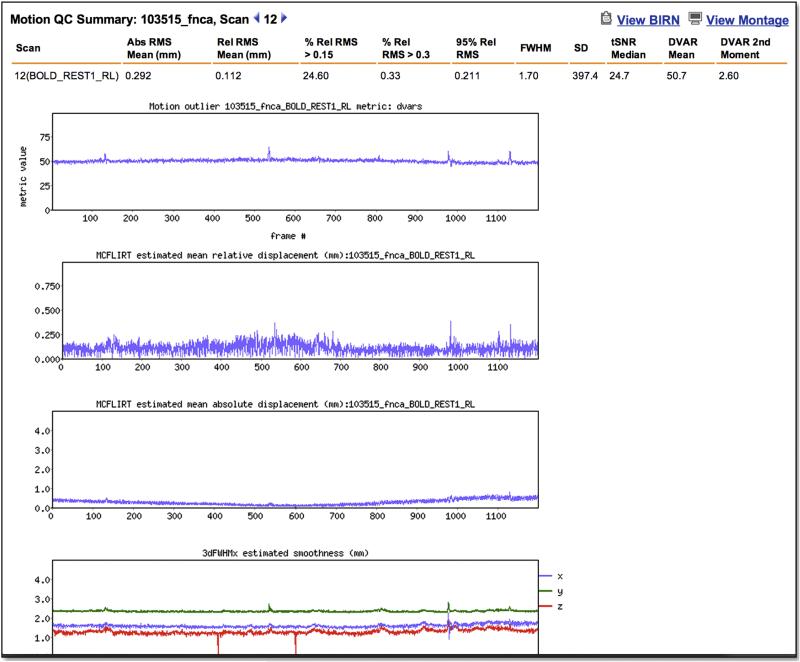
Figure 4. Quality control reports.
IntraDB includes detailed reports for reviewing data and quality control information. A session-level report (top) provides modality-specific summary statistics for each scan. For fMRI, this includes the output of the FUNCTIONAL_QC pipeline (temporal SNR, DVARS, FWHW, etc). Detailed plots of these measures across time (bottom) can be viewed by clicking on a link within the report. The full report generated by the BIRN QA pipeline can also be accessed.


