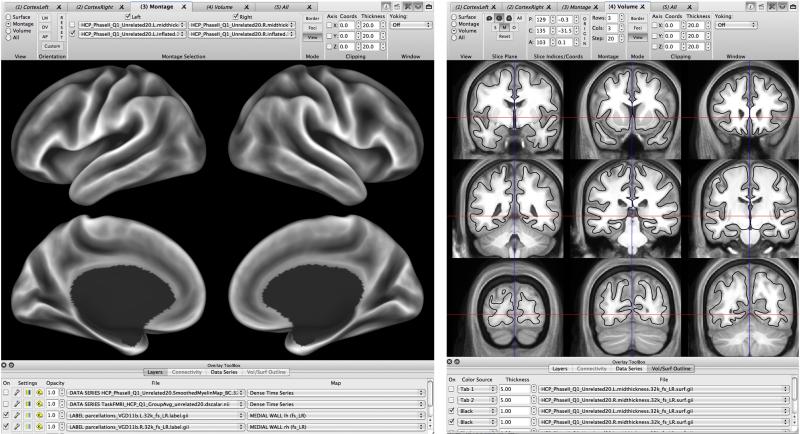
Figure 8. Example of surface and volume visualization in Connectome Workbench.
Left: A montage view of a population-average inflated surface showing the FreeSurfer-generated average ‘sulc’ map displayed on medial and lateral views of left and right hemispheres. Right. A montage volume-slice view of the population-average T1w volume. The population-average midthickness surface (black contour) does not perfectly overlay the average T1w gray-matter pattern, because there are significant differences in the inter-subject alignment achieved by nonlinear volume-based vs surface-based registration.

