Figure 1.

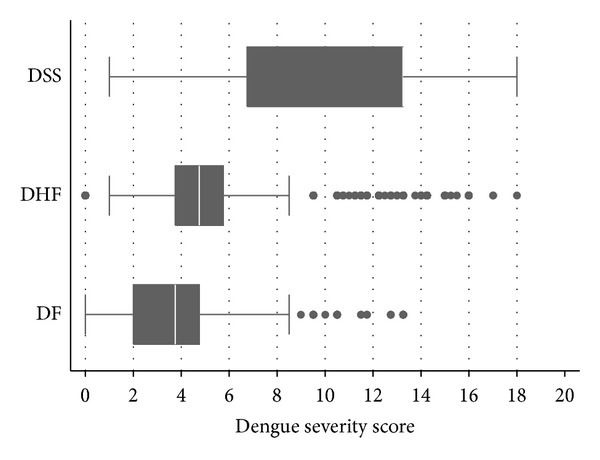
Distribution of dengue severity scores by severity levels. Vertical lines in box represent medians. Box boundaries represent the twenty-fifth and seventy-fifth percentiles.

Distribution of dengue severity scores by severity levels. Vertical lines in box represent medians. Box boundaries represent the twenty-fifth and seventy-fifth percentiles.