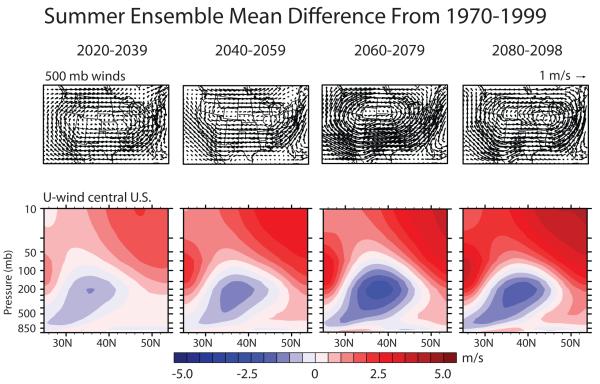
Figure 7.
Twenty-first century anomalies in summer atmospheric circulation. Ensemble anomalies from the 1970-1999 baseline are calculated as the mean of the anomalies in the five RegCM3 members for the 2020-2039, 2040-2059, 2060-2079, and 2080-2098 periods. The top row shows the anomalies in 500 mb wind vectors. The bottom row shows the U component of the wind over the central U.S. (averaged between 102.4°W and 82.7°W).

