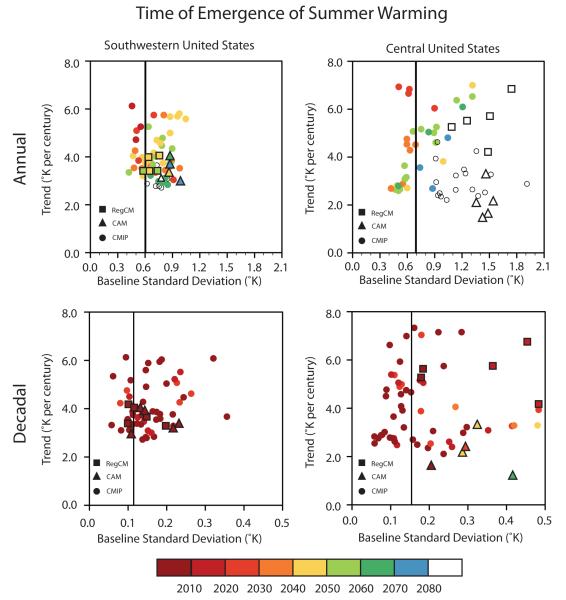
Figure 8.
Time of emergence of summer warming beyond the baseline variability for individual realizations of the high-resolution ensemble and the CMIP3 AOGCM ensemble. The annual and decadal timings are calculated as in Figure 1.The left panels show the emergence values for the southwestern U.S. (31.6-43.8°N, 123.6-105.6°W). The right panels show the emergence values for the central U.S. (32.0-44.0°N, 102.4-82.7°W). For these regional emergence calculations, we first create a regional temperature timeseries and then calculate the time of permanent emergence from that regional series. The horizontal axis is the standard deviation over the 1970-1999 period, with the vertical lines showing the observed value over the region. The vertical axis is the regional temperature trend over the 21st century.

